There's a strong distinction to be made between "wet code," interpreted by the brain, and "dry code," interpreted by computers. Human-read media is wet code whereas computer code and computer-readable files (to the extent a computer deals meaningfully with them) are "dry code." Law is wet code, interpreted by those on whom the law is imposed, and interpreted (often somewhat differently) by law enforcers, but most authoritatively (and even more differently) interpreted by judges. Human language is mostly wet code but to the extent computer programs crudely translate from one language to another, keyword-ad programs parse text to made an educated guess as to what ads a user will most likely click, and so on, human language text can also be dry code. Traditional contracts are wet code whereas smart contracts are mostly dry code. Secure property titles and the domain name system are mostly dry code.
Even "mostly dry code" often has surprisingly soggy portions. Smart contracts, for example, can use dialogs to communicate their nature to the user and to allow the user to at least input some parameters, make menu choices, and the like. These are cognitive channels that translate between wet code and dry code. Similarly, the human-readable name in the domain name system is wet code and trademark law is wet code that applies to domain names. Phishing is an attack against cognitive channels using ambiguous wet code, which is probably why dry code programmers have a hard time coming to grips with it.
The syntactic properties of wet and dry code are often very similar -- for example, both human and computer language can usually be parsed by pushdown automata into context-free grammars. But their semantic content is often radically different, and the semantic content of wet code is often simply unintelligible to a computer, for a variety of often mysterious reasons. If we had good enough theories of human semantics we could program such theories into the computer and the computer would then understand like a brain after all. But we don't, in most areas, so we mostly can't program computers to emulate humans. I believe these mysteries are primarily due to the highly evolved nature of the brain contrasted to the recent and thus naive designs of computers, especially with respect to computers' typical lack of good sensors (they're mostly still far more sensory-deprived than Helen Keller, who had a very informative sense of touch) and relative inability to learn from natural and social environments. Their ability to aggregate disparate kinds of information, for example through conceptual metaphor, is also relatively undeveloped.
As computers become "smarter" dry code is (very slowly) coming to do more that was formerly only done by wet code. Once it successfully emulates wet code it soon surpasses it in many respects; for example by now dry code can do simple arithmetic billions of times faster than the typical human. As the idea of smart contracts suggests, there are many fruitful analogies to be made from wet code to dry code, but we must keep in mind the radically different semantics, the strengths and weakness of each, and the need for each to interact with the other to solve real problems.
I don't think there is a "magic bullet" theory of artificial intelligence that will uncover the semantic mysteries and give computers intelligence in one fell swoop. I don't think that computers will mysteriously "wake up" one day in some magic transition from zombie to qualia. (I basically agree with Daniel Dennett in this respect). Instead, we will continue to chip away at formalizing human intelligence, a few "bits" at a time, and will never reach a "singularity" where all of a sudden we one day way wake up and realize computers have surpassed us. Instead, there will be numerous "micro-runaways" for particular narrow abilities that we learn how to teach computers to do, such as the runaway over the last century or so in the superiority of computers over humans in basic arithmetic. Computers and humans will continue to co-evolve with computers making the faster progress but falling far short of apocalyptic predictions of "Singularity," except to the extent that much of civilization is already a rolling singularity. For example people can't generally predict what's going to happen next in markets or which new startups will succeed in the long run.
Sunday, August 24, 2008
Wednesday, August 20, 2008
Genoa
 Genovese coat of arms with gryphons and cross of St. George.
Genoa was the most commercially innovative city of premodern times. Insurance, the joint-stock corporation, close cooperation between navy and merchant marine, international trade and exploration, and banking all made substantial progress in Genoa. The basic drivers of these innovations were Genoa's merchant culture and its unprecedented commitment to freedom of contract.
 La Lanterna, the harbor lighthouse. 40 meters of rock and 77 meters of tower put the lantern 117 meters above sea level at the harbor mouth. The current version dates from the 16th century, but a lighthouse tower has been at the location from at least the 12th century.
Genoa was probably a significant port under the Greeks, Etruscans, and then the Romans, but is not recorded as playing a major role in history during those periods. It declined in the Dark Ages but revived by the 11th century and was one of the first Italian towns to assert its independence. It played an important role in transporting and protecting crusader fleets and those of the merchants and colonists who followed. During the Crusades it gained footholds on the strategic bottlenecks of the Dardanelles and of the Bosporus across from Constantinople, giving it access to the Black Sea and the Silk Road to China.
The Genovese were the chief commercial innovators of the later Middle Ages, and if anything was key to their innovations it was their advanced contract law and their commitment to freedom of contract. Nothing showed this commitment more than its long struggle against Church doctrine banning usury, which at the time meant any charging of interest. Genovese contracts "hid" interest charges as profits (which were acceptable) or in exchange rates.
 The Galata Tower, built by the Genovese on the Bosporus across from Constantinople during the crusades. Their shared control over the Bosporus opened up the lucrative Oriental trade and allowed them to plant colonies along the Black Sea.
An example of the use of exchange rates to incorporate interest was the "dry loan" which structured interest as a transport charge commonly used in a "wet loan" which were normally paid off in a distant city as a way of transmitting money. Church leaders recognized many of these ruses and complained, but since Genovese municipal judges were, like the rest of the Genovese community, staunch advocates of freedom of contract, and since the Church was dependent on Genovese power (for example to transport and protect crusaders and pilgrims on the seas), the judges winked at these ruses and the Church mostly did not crack down on the practice. In the process of developing these ruses the Genovese became creative drafters of commercial contracts and learned to distinguish elements such as risk, loan, and investment that had been bundled together and treated as inseparable in previous eras.
Perhaps the chief Genovese innovation was modern insurance unbundled from credit or investment:
In short succession Genoa developed insurance, insurance pools secured by landed estates, and reinsurance. Exchanges sprang up for trading public debt, commodity futures, and other commercial paper. Bankruptcy law and the settlement of international trade disputes reached new levels of sophistication. Accounting became widespread and double-entry bookkeeping was born. As a result of their cumulative breakthroughs in institutions and technology, Europeans became the first merchants to travel and trade around the entire globe.Medieval Genovese merchants, like their Venetian rivals, traveled from Iceland to China. Later Genovese such as Christopher Columbus would lead exploration of the New World.
Insurance developed out of an ancient form of marine finance, a loan that only had to be paid back if the ship returned safely:
The earliest risk-pooling insurance contracts were structured similarly to, and enforced under the same legal principals as, loans. Indeed they bundled a loan from the combined investor/insurer with an insurance clause -- in the event that the ship was wrecked, the loan need not be paid back. In 14th century Genoa, we see the separation of the investor from the insurer, via a contract with its conditional clause but requiring no initial loan. Investment contracts became separate entities and could be contracted with different parties, greatly improving the spreading of risk for these ventures. Such improved risk management was crucial for the explosion of overseas trade that Europe initiated over the succeeding centuries.One of the most innovative families were the Vivaldis. Frederico Vivaldi was the one of the first merchants to be insured in the new way, and we still have some of his insurance contracts. His ancestors Vandino and Ugolino Vivaldi were famous merchants and explorers of the west coast of Africa, pioneering new discoveries and a lucrative trade that would be exploited much more by the Portuguese starting in the 15th century, taking advantage of its naval control over the Straights of Gibraltar (which Genoa never clearly gained, since before the Portuguese conquest of Ceuta Muslims controlled both shores). Today the University of Genoa sits on the Via Vivaldi, named after this most adventurous of families.
 The Genoan topography helped it protect warehouses full of goods, Genoa's main source of wealth, as well as its populace.
Another famous Genovese family was the D'orias. Tedesio D'Oria funded the Vivaldi brothers in their last voyage, an ill-fated attempt at the end of the 13th century to pioneer a route to India -- a feat not accomplished until about two hundred years later by the Portuguese. In the attempt they may have (re)discovered the Canary Islands, which in any case the Genovese would colonize by the middle of the 14th century. Andrea Doria was the most famous Genovese admiral, responsible for defeating the Turks in the naval battle of Lepanto, among other feats.
Genoa was also the birthplace of corporations traded by shares, the prototype for the later English joint-stock corporation. Like many of the early English joint-stock companies, most of the Genovese companies were colonial companies that derived their revenue from tribute, tax, and trade from the many colonies they established:
The medieval organizations that most resembled later joint-stock corporations were the Genovese maone. These bore some strong resemblances to the publicani tax farming corporations of the Roman Republican era, although it is not clear how they could have survived the intervening Late Empire and Dark Ages other than as very obscure (and perhaps now lost) written descriptions. In form and function maone also bore strong resemblances to some early joint-stock companies such as the Bank of Amsterdam, Bank of England, and the Dutch and English East India Companies.Genoa was limited in its naval endeavors because Muslims, and then by the end of the 15th century the Portuguese and Spanish, controlled the Straights of Gibraltar. The Genovese nevertheless supplied several leading navigators of the great Age of Exploration, including Nicoloso da Recco, Lanzarotto Malecello, Antoniotto Uso di Mare, Christopher Colombus and probably the Cabots. Its merchants also played a leading role in investing in Spanish and later English endeavors. But with the Reformation the center of commercial innovation would move from Italy to the Netherlands and England. Those innovators stood on the shoulders of giants, and the biggest such giant had been Genoa.Palazzo San Giorgio (St. George). The Bank of San Giorgio (est. 1407) came to handle most of the municipal debt, providing a prototype for later central banks such as the Bank of Amsterdam and the Bank of England.
The Italian cities often sold off their tax receivables to wealthy merchants at a discount as a way to borrow funds. (Discounting was one of the many ways late medieval financiers avoided the rather lax and formalistic usury restrictions that remained in Genoa). The debts were divided into equal shares called loca or partes. Legally, these debt shares were personal property (chattels) and could be freely traded.
Technically, no organization was created when the city sold its tax receivables to merchants. However, to effectively collect the taxes, the holders of loca formed an organization called a maona or societas comperarum. This organization would then subcontract to tax farmers to collect the taxes. By the fourteenth century, Genovese maone also engaged in military conquest and colonization. These were, quite literally, corporate raiders.Il borsa (the Exchange). Genoa pioneered in issuing and trading shares of ships and of municipal and corporate debt.
Normally, maone were temporary, but some of them ended up lasting for a long time. In 1346 the Maona di Chio e di Focea (a company for managing the taxes of Chios and Focea) was formed. This organization's members obtained from Genoa the exclusive right to collect taxes from Chios (an Aegean island) and Phocaea (a port on the Anatolian coast). But first the company would have to conquer them! Although technically a temporary organization, it lasted until 1566.
Rather than going to buy receivables from Genoa, subscriptions to the di Chio e di Focea's loca shares (still legally debt, but to be paid out in dividends as taxes and trading revenues were collected) went to fund 29 galleys to conquer Chios and Phocaea. The Genovese Republic, for a fee, granted the organization exclusive rights to collect taxes from the conquered territories as well as special trading privileges. The conquests, taxes, and trading were at least partially successful, and by the 16th century more than 600 persons owned loca of this maona. This function and some of this structure would later be emulated by the Dutch and English India Companies, but with a basic legal difference -- "shares" in these later joint-stock companies would constitute ownership (like ship shares) not debt as with the maona.


 Flag with traditional English symbols: gryphons and cross of St. George. More importantly, England borrowed and improved upon many Genovese commercial innovations, ushering in the modern era of global trade and the industrial revolution.
England was strongly allied with Genoa throughout much of the Middle Ages. It is thought by some that English symbols such as the Cross of St. George and the gryphon derive from this alliance. English ships flying the Cross of St. George in the Mediterranean were protected by Genovese fleets. More importantly, England derived many of the institutions most critical to the development of overseas trade and colonies and domestic industry from Genoa. England, like the Genovese and Portugal (and unlike many other powers of the time such as China) put their navy primarily on the task of protecting its merchant marine. Its joint stock corporations, many of them colonial, derived from the Genovese colonial companies with their interests divided into shares. Lloyd's of London, with "Names" putting up their estates as collateral for reinsurance, still has the same basic structure as the marine insurance pools pioneered in the 14th century by the Genovese.
Patterns of integrity
One of my main interests is the history of institutions, and in particular the patterns that recur in successful institutions. These organizational structures and security mechanisms allow naturally suspicious strangers to interact with integrity.
These patterns include tamper evidence, shared time, unforgeable costliness, separation of duties, the principle of least authority, risk sharing, and learning from our ancestors, among many others. These patterns have been useful for centuries, and (I can report after having spent many years working in the computer network security field) continue to be useful in the Internet era.
These patterns include tamper evidence, shared time, unforgeable costliness, separation of duties, the principle of least authority, risk sharing, and learning from our ancestors, among many others. These patterns have been useful for centuries, and (I can report after having spent many years working in the computer network security field) continue to be useful in the Internet era.
Reruns
Unenumerated is going into reruns season. For the next few weeks I will be reposting the best articles from this blog. These will mostly be posts from previous years, so unless you have been a reader since the beginning or have read most of the archives many of these will be new to you.
Most blogs discuss the news or similar ephemera and for them reruns would be silly, but this blog mostly discusses issues of historical or otherwise long-term importance, and I will only be rerunning those kinds of articles. If you haven't read a particular old article from Unenumerated yet it will be as informative and entertaining today as when it was first posted.
I will probably have "theme weeks" where this blog will run several classic articles on a particular theme (jurisdiction, legal/political procedure, property, contracts, money, traditional security, online security protocols, media, etc.).
Most blogs discuss the news or similar ephemera and for them reruns would be silly, but this blog mostly discusses issues of historical or otherwise long-term importance, and I will only be rerunning those kinds of articles. If you haven't read a particular old article from Unenumerated yet it will be as informative and entertaining today as when it was first posted.
I will probably have "theme weeks" where this blog will run several classic articles on a particular theme (jurisdiction, legal/political procedure, property, contracts, money, traditional security, online security protocols, media, etc.).
Monday, August 11, 2008
Inflation expectations, gold, and oil
James Hamilton (link below) commits an egregious, but all too common, error:
In expectation terms, the euro/dollar exchange rate reflects relative inflation expectations and surprise relative inflation between the dollar and the euro, whereas the monetary component of the dollar oil price reflects absolute inflation expectations and surprise absolute inflation for the dollar.
Analyzing the weekly price quotes since 2000, I get a correlation coefficient of 0.93 between the dollar price of gold and the dollar price of oil -- both absolute measures of dollar inflation expectations and surprise dollar inflation. The alternative hypotheses, changes in expectations and surprises in technological/geological supply or industrial demand, have very different effects on gold and oil that should lead to low correlations between their prices. The high correlation between gold and oil implies that oil as well as gold price changes are dominated by monetary factors. Many professional economists seem to be in denial about these basics of life under fiat currencies, perhaps since this ruins using the highly visible gas prices for simple chapter 1 lessons about how the fundamentals of consumption demand and supply by themselves are supposed to fully determine prices. These chapter 1 exercises, besides neglecting expectations, assume fixed-value currencies, and spectacularly fail for mineral commodities in our world of fiat currencies. In that world there is a monetary component to mineral commodity prices exponential in size to the expected inflation rate. This monetary component always dominates the gold price and at more than minimal levels of expected inflation (i.e. > ~2%/year) it also dominates oil prices, as demonstrated by the high correlation between gold and oil prices since 2000.
[UPDATE: another thing that puzzles many economists is why oil consumption has not dramatically slackened, and indeed in some areas has still risen, in response to climbing oil prices. This demand puzzle is a problem for any theory, whether monetary or fundamental. The answer involves demand fundamentals, but does not involve fundamentals that have changed substantially in the last decade: demand forms a fairly constant backdrop for the monetarily-driven dramatic rise in oil prices; it does not itself explain the rise. The answer to the demand puzzle is that despite all the recent political sci-fi rhetoric to the contrary, oil is a superior form of energy, often with no economical ready substitutes, as well as a great chemical feedstock. Automobiles in particular give us quite valuable real options that the vast majority of us actively seek and are extremely reluctant to give up. When gas prices go up we cut back on luxuries and many other kinds of necessities to make room for greater gas expenditures. Alternatives are typically costly status items, like hybrids, that are not practical substitutes for most people. As a result the demand for oil is far less elastic than for most commodities. Furthermore, because the dramatic oil price rise of the last decade is largely a monetary not a fundamental effect, the costs of alternative energies and conservation are also inflating -- they are simply much stickier than oil prices and will thus lag but eventually catch up to them. Investments in them will turn out far worse than a mere fundamental analysis would indicate, and enough people remember the 1970s, and how tacky and dangerous the small cars everybody bought in the late 1970s and early 1980s seemed by the late 1980s, that this has made people more reluctant to buy small or alternative in the current runup. Adding to oil's inelasticity are the many countries that subsidize fuel consumption.
Observe that this inelasticity and these subsidies, while important for explaining the demand puzzle, have not changed substantially as dollar oil prices have climbed by more than a factor of 10 since 1998. The component of the demand curve reflecting fundamentals has gradually risen, but it has also risen by a similar proportion in many prior decades and can't explain any dramatic increase in oil prices. What has changed are inflation expectations, driven by increasing government deficits and expected central bank behavior in response to the credit crunch, among other monetary factors. Our higher oil and gold prices reflect, exponentially, the increase in these expectations.]
(Here's the link to Hamilton's erroneous analysis, H/T Marginal Revolution, and my comments above were originally made at that blog, and appear here slightly edited).
Here are two graphs I've recently made based on my historical studies of the relationships between inflation, long-term inflation expectations, gold, and oil (click to enlarge):

The first graph shows implied expected inflation based on historical weekly gold and oil prices, 2000-2008. The oil and gold prices are adjusted for an estimate of historical inflation (specifically inflation as measured by CPU-I up to the date of the price, as opposed to inflation expected after the date of the price, which these adjusted prices imply) and for a small fundamental long-term trend (see below). The absolute expected inflation is based on certain baseline assumptions, whereas the relative changes in inflation expectations are not based on these parameters but simply on the theory that the oil and gold prices reflect the net present value of expected inflation, which is an exponential function. There is a close correlation, specifically 0.93, between the weekly movements of gold and oil prices in this period. The expectations implied by oil include both monetary component reflected by this correlation as well as a much smaller component primarily reflecting differing expectations and surprises between gold and oil in industrial demand and technologicaly/geological supply.
The separate oil (in gold prices) expectation graph reflects this difference. My attribution of all the differences between gold and oil to these fundamentals assumes that there has been insignificant change in the relative demand for gold and oil as money, which may be dubious assumption give the great recent rise in the use of oil and other commodity derivatives to hedge inflation in investment portfolios, and also the possibility that the security of economic property rights (i.e. effective long-term control by the same entity) in oil has increased recently faster than that of gold. But the fundamental contribution to the price of oil in terms of gold must be substantial since the graph of the difference in price expectations between the two reflects major events impacting oil demand such as 9/11(which along with the recession from the dot-com crash greatly impacted world and especially U.S. travel, reducing oil demand).
A few potentially important monetary events, such as the appointment of Ben Bernanke to replace Alan Greenspan as Fed chairman, are also labeled. There is a significant increase in the both the level and volatility of inflation expectations around and after this appointment as the market tried to predict how inflationary Fed policy under Bernanke might become, and generally indicated that higher inflation could be expected from Bernanke than Greenspan. Even before Bernanke was chosen, the ballooning federal deficits after 9/11 caused a gradual but substantial increase in inflation expectations from then until the end of Greenspan's term. Over his entire leadership from 1987 to 2006, Greenspan lowered inflation expectations from about 4% to below 2%, and they then rose to about 2 1/2% by the end of Greenspan's term, and are back above 4% today. (Greenspan in his own book, The Age of Turbulence, published in 2007, says that with fiat currencies we can expect inflation of about 4.5% from here on out, a more pessimistic estimate than that probably implied by gold prices in 2007, but perhaps a bit more prescient than the market given that inflation expectations have increased to above 4% in 2008. Of course, remember that my model reflects changes in inflation expectations much better than absolute inflation expectations, so these absolute numbers are very approximate).
Not shown on these graphs is a very interesting possible difference of nearly 1% between inflation expectations implied by gold, recently a bit over 4%, and expectations implied by TIPS (U.S. Treasury bonds with returns adjusted by the U.S. CPU-I inflation index), recently 3.3% The difference may largely reflect the errors I have suggested might exist in my absolute (but not relative) numbers due to my choices of parameters, but they might also reflect one or more of the following:
(1) The difference between the consumption basket of the U.S. urban consumer (as reflected in the CPU-I) and a global consumption basket;
(2) Understatement of actual subjectively experienced inflation by the CPU-I formual based on errors in its formula, perhaps including the "hedonic" and other adjustments made to it in recent years (we don't have TIPS prices to measure differences in gold- and TIPS-implied inflation prior to 2005);
(3) subtleties involving discount rate and utility curve differences between the U.S. urban consumer and some global average; and/or
(4) Prices on the 10-year TIPS reflect inflation expectations only over the next 10 years, whereas gold reflects inflation expectations over an indefinetely long period. If some event (e.g. the baby boomers reaching years of requiring peak medical attention, causing U.S. government deficits to skyrocket) posing great inflation risks is expected to occur within a foreseeable period of time but not within the next 10 years, this could be reflected in a spread between the two implied expectations.
There is also a small component of long-term relative oil/gold fundamentals in my analysis. Since the 1950s, oil prices have increased on average 0.9%/year faster than gold, which I have attributed to a fundamental difference between the two: a greater proportion of oil is actually consumed every year than gold, and so oil is gradually (i.e. at 0.9%/year) becoming scarcer relative to demand than gold. The graphs and implied inflations are adjusted for this effect. This is as close the numbers attribute any reality to "peak oil" theories: they show that we do not face an imminent demise of the oil economy, only a very long and very gradual increase in the technological/geological scarcity relative to consumption demand for oil. Extrapolating the same rate as the last 50 years, the price of oil in terms of gold will take 80 years to double. Taking out monetary factors and this gradual effect, we have had in the recent years (indeed since 1999, although until about 2003 this was masked by low inflation expectations) a small acute crisis in the fundamentals of oil, rising a bit above the 0.9%/year trend as it did in the 1970s, but this burp not substantially greater than in many former years such as in the 1970s, and I expect it, as occured in the 1980s, to reverse from technological substitutes for and conservation of oil which we are currently (as in the late 1970s and early 1980s) overinvesting in, due to monetary effects on oil prices being mistaken for fundamental ones. This mistake will reify as alternative energies and conservation techniques (barring unexpected technological breakthroughs), with stickier prices lagging those of oil in reflecting inflation expectations, increase in price faster than oil in the next decade (assuming no further monetary problems that further increase inflation expectations and thus oil prices). Prices besides oil, gold, and to a lesser extend other mineral commodities are far stickier than those mineral prices. Once inflation expectations increase, it takes many years for other prices (and especially the stickiest prices of all, wages) to catch up to oil and gold: these other prices greatly lag both increases and decreases in oil and gold prices, and indeed may never catch up at all if the expectations turn out to be wrong (as they indeed often are, given how little information the market actually has on future U.S. government and Fed behavior!)
 The second graph shows this expected versus the actual (or at least CPI-U) dollar inflation from 1968 to today. Again from the difference between oil and gold we can see some oil fundamentals such as the impact of the Asian/Russian crisis on lowering oil prices (in terms of gold as well as, in this case, dollars, as inflation expectations were also at their lowest) in 1998 and of the Iran/Iraq war which depressed oil prices in terms of gold in the 1980s (probably due to decreased security of long-term economic property rights in their oil and the need by these oil states to fund their war with limited ability to borrow).
Since I generated these graphs three weeks ago, there has been a substantial and as usual correlated drop in both dollar gold and oil prices, probably reflecting an easing of the credit crunch in the U.S. and more confidence that the Fed, seeing its inflationary behavior lead to immediate and politically consequential pain at the gas pump, is less likely to use high inflation to default on current U.S. debts than was thought in previous weeks. At the same time the overt default risk for Treasuries has nearly tripled, also reflecting some new political limits on inflationary default. By the way, in the most recent week the dollar also strengthened against the euro by a similar amount, so that the explanation for last week, but not most of the previous ones, involves a monetary improvement unique to the dollar rather than shared by the Fed and the ECB.

[UPDATE: here's a third graph showing implied inflation expectations derived from monthly quotes of gold and oil in dollars going back to 1974, using some different parameters than were used for the second graph econd graph. The two expectations have a correlation coefficient of 0.76. (I forgot to run the correlation with the parameters that generated the second graph, so I wanted to show the graph corresponding to the 0.76). This is still a strong correlation consistent with the long-term trends in oil and gold prices each reflecting a common estimate of future inflation -- gold and oil fundamentals are very different and so cannot lead to such strong correlation. This compared to two random walks with no long-term tendency to rise, which on average have no correlation.
Per the comments below, the 0.93 coefficient cited above might for statistical reasons suggest much more correlation than actually there due to the rising nature of both making the differences from the mean calculated in the coefficient consistently large and thus reducing the proportional difference in movements: a random walk that tends to rise can also have correlation coefficients in the .60's to .90's. Indeed taking correlations of differences we get only .25, on the high end of weak positive correlations, for one-week deltas, but this rises with the weeks of difference: I've calculated up to 40 week deltas which give 0.64, a strong correlation. This suggests that weekly fluctuations are dominated more by non-monetary factors and the monetary factors don't start to dominate until the price movements are over about 6 months: fundamental fluctuations tend to be shorter term and tend (except for the 0.9% secular trend for which I've adjusted the data) cancel each other out. There are also as I undestand it, and I am admittedly no statistical expert, statistical reasons to expect that the 0.25 is too low in that such differencing can exagerate noise. For the two implied inflation expectations in the third graph, which have a 0.76 correlation coefficient, the exageratedly small differences in proportion due to large distances from the mean should be greatly reduced since the series is largely flat, finishing pretty much where it started. But all this must be subject to review by people far more knowledge in statistics than I. :-) ]
Yet another example, and the one people often think of first, would be if there is a higher inflation rate in the U.S. than Europe. In that case we might expect to see an increase in the price of oil that exactly equals (in percentage terms) the decrease in the value of the dollar...The graph below plots the cumulative logarithmic change since 1999 in the dollar price of one euro along with the dollar price of one barrel of oil...Hamilton then computes correlation coefficients between dollar oil prices and the euro/dollar exchange rate, finds a number of periods in which they are not closely correlated, and concludes that the dollar does not explain most of the dramatic rise in oil prices. Why do we keep seeing this kind of reasoning from supposed authorities like Mr. Hamilton? The flaw should be quite obvious, but since I've seen it mindlessly and repeatedly perpetrated by a number of professors of economics over the last few months, allow me to tediously correct it: if greater inflation is expected in both the euro and the dollar, the price of oil will increase in both euros and dollars. The euro/dollar exchange rate reflects relative monetary changes between the dollar and the euro, and the monetary component of the dollar oil price reflects absolute monetary changes in the dollar. It is absurdly illogical to expect the relative and the absolute to be strongly correlated. If the monetary changes in the euro and the dollar are of similar magnitude and direction, oil and gold prices will go up or down for these monetary reasons while the exchange rate changes little for these reasons. If European and U.S. monetary authorities are reacting in similar ways to, for example, similar credit crunches, there is no reason to expect a substantial correlation between euro/dollar exchange rates and oil prices. We will see such correlation for monetary reasons only when they are reacting with substantially different magnitudes or in different directions.
In expectation terms, the euro/dollar exchange rate reflects relative inflation expectations and surprise relative inflation between the dollar and the euro, whereas the monetary component of the dollar oil price reflects absolute inflation expectations and surprise absolute inflation for the dollar.
Analyzing the weekly price quotes since 2000, I get a correlation coefficient of 0.93 between the dollar price of gold and the dollar price of oil -- both absolute measures of dollar inflation expectations and surprise dollar inflation. The alternative hypotheses, changes in expectations and surprises in technological/geological supply or industrial demand, have very different effects on gold and oil that should lead to low correlations between their prices. The high correlation between gold and oil implies that oil as well as gold price changes are dominated by monetary factors. Many professional economists seem to be in denial about these basics of life under fiat currencies, perhaps since this ruins using the highly visible gas prices for simple chapter 1 lessons about how the fundamentals of consumption demand and supply by themselves are supposed to fully determine prices. These chapter 1 exercises, besides neglecting expectations, assume fixed-value currencies, and spectacularly fail for mineral commodities in our world of fiat currencies. In that world there is a monetary component to mineral commodity prices exponential in size to the expected inflation rate. This monetary component always dominates the gold price and at more than minimal levels of expected inflation (i.e. > ~2%/year) it also dominates oil prices, as demonstrated by the high correlation between gold and oil prices since 2000.
[UPDATE: another thing that puzzles many economists is why oil consumption has not dramatically slackened, and indeed in some areas has still risen, in response to climbing oil prices. This demand puzzle is a problem for any theory, whether monetary or fundamental. The answer involves demand fundamentals, but does not involve fundamentals that have changed substantially in the last decade: demand forms a fairly constant backdrop for the monetarily-driven dramatic rise in oil prices; it does not itself explain the rise. The answer to the demand puzzle is that despite all the recent political sci-fi rhetoric to the contrary, oil is a superior form of energy, often with no economical ready substitutes, as well as a great chemical feedstock. Automobiles in particular give us quite valuable real options that the vast majority of us actively seek and are extremely reluctant to give up. When gas prices go up we cut back on luxuries and many other kinds of necessities to make room for greater gas expenditures. Alternatives are typically costly status items, like hybrids, that are not practical substitutes for most people. As a result the demand for oil is far less elastic than for most commodities. Furthermore, because the dramatic oil price rise of the last decade is largely a monetary not a fundamental effect, the costs of alternative energies and conservation are also inflating -- they are simply much stickier than oil prices and will thus lag but eventually catch up to them. Investments in them will turn out far worse than a mere fundamental analysis would indicate, and enough people remember the 1970s, and how tacky and dangerous the small cars everybody bought in the late 1970s and early 1980s seemed by the late 1980s, that this has made people more reluctant to buy small or alternative in the current runup. Adding to oil's inelasticity are the many countries that subsidize fuel consumption.
Observe that this inelasticity and these subsidies, while important for explaining the demand puzzle, have not changed substantially as dollar oil prices have climbed by more than a factor of 10 since 1998. The component of the demand curve reflecting fundamentals has gradually risen, but it has also risen by a similar proportion in many prior decades and can't explain any dramatic increase in oil prices. What has changed are inflation expectations, driven by increasing government deficits and expected central bank behavior in response to the credit crunch, among other monetary factors. Our higher oil and gold prices reflect, exponentially, the increase in these expectations.]
(Here's the link to Hamilton's erroneous analysis, H/T Marginal Revolution, and my comments above were originally made at that blog, and appear here slightly edited).
Here are two graphs I've recently made based on my historical studies of the relationships between inflation, long-term inflation expectations, gold, and oil (click to enlarge):

The first graph shows implied expected inflation based on historical weekly gold and oil prices, 2000-2008. The oil and gold prices are adjusted for an estimate of historical inflation (specifically inflation as measured by CPU-I up to the date of the price, as opposed to inflation expected after the date of the price, which these adjusted prices imply) and for a small fundamental long-term trend (see below). The absolute expected inflation is based on certain baseline assumptions, whereas the relative changes in inflation expectations are not based on these parameters but simply on the theory that the oil and gold prices reflect the net present value of expected inflation, which is an exponential function. There is a close correlation, specifically 0.93, between the weekly movements of gold and oil prices in this period. The expectations implied by oil include both monetary component reflected by this correlation as well as a much smaller component primarily reflecting differing expectations and surprises between gold and oil in industrial demand and technologicaly/geological supply.
The separate oil (in gold prices) expectation graph reflects this difference. My attribution of all the differences between gold and oil to these fundamentals assumes that there has been insignificant change in the relative demand for gold and oil as money, which may be dubious assumption give the great recent rise in the use of oil and other commodity derivatives to hedge inflation in investment portfolios, and also the possibility that the security of economic property rights (i.e. effective long-term control by the same entity) in oil has increased recently faster than that of gold. But the fundamental contribution to the price of oil in terms of gold must be substantial since the graph of the difference in price expectations between the two reflects major events impacting oil demand such as 9/11(which along with the recession from the dot-com crash greatly impacted world and especially U.S. travel, reducing oil demand).
A few potentially important monetary events, such as the appointment of Ben Bernanke to replace Alan Greenspan as Fed chairman, are also labeled. There is a significant increase in the both the level and volatility of inflation expectations around and after this appointment as the market tried to predict how inflationary Fed policy under Bernanke might become, and generally indicated that higher inflation could be expected from Bernanke than Greenspan. Even before Bernanke was chosen, the ballooning federal deficits after 9/11 caused a gradual but substantial increase in inflation expectations from then until the end of Greenspan's term. Over his entire leadership from 1987 to 2006, Greenspan lowered inflation expectations from about 4% to below 2%, and they then rose to about 2 1/2% by the end of Greenspan's term, and are back above 4% today. (Greenspan in his own book, The Age of Turbulence, published in 2007, says that with fiat currencies we can expect inflation of about 4.5% from here on out, a more pessimistic estimate than that probably implied by gold prices in 2007, but perhaps a bit more prescient than the market given that inflation expectations have increased to above 4% in 2008. Of course, remember that my model reflects changes in inflation expectations much better than absolute inflation expectations, so these absolute numbers are very approximate).
Not shown on these graphs is a very interesting possible difference of nearly 1% between inflation expectations implied by gold, recently a bit over 4%, and expectations implied by TIPS (U.S. Treasury bonds with returns adjusted by the U.S. CPU-I inflation index), recently 3.3% The difference may largely reflect the errors I have suggested might exist in my absolute (but not relative) numbers due to my choices of parameters, but they might also reflect one or more of the following:
(1) The difference between the consumption basket of the U.S. urban consumer (as reflected in the CPU-I) and a global consumption basket;
(2) Understatement of actual subjectively experienced inflation by the CPU-I formual based on errors in its formula, perhaps including the "hedonic" and other adjustments made to it in recent years (we don't have TIPS prices to measure differences in gold- and TIPS-implied inflation prior to 2005);
(3) subtleties involving discount rate and utility curve differences between the U.S. urban consumer and some global average; and/or
(4) Prices on the 10-year TIPS reflect inflation expectations only over the next 10 years, whereas gold reflects inflation expectations over an indefinetely long period. If some event (e.g. the baby boomers reaching years of requiring peak medical attention, causing U.S. government deficits to skyrocket) posing great inflation risks is expected to occur within a foreseeable period of time but not within the next 10 years, this could be reflected in a spread between the two implied expectations.
There is also a small component of long-term relative oil/gold fundamentals in my analysis. Since the 1950s, oil prices have increased on average 0.9%/year faster than gold, which I have attributed to a fundamental difference between the two: a greater proportion of oil is actually consumed every year than gold, and so oil is gradually (i.e. at 0.9%/year) becoming scarcer relative to demand than gold. The graphs and implied inflations are adjusted for this effect. This is as close the numbers attribute any reality to "peak oil" theories: they show that we do not face an imminent demise of the oil economy, only a very long and very gradual increase in the technological/geological scarcity relative to consumption demand for oil. Extrapolating the same rate as the last 50 years, the price of oil in terms of gold will take 80 years to double. Taking out monetary factors and this gradual effect, we have had in the recent years (indeed since 1999, although until about 2003 this was masked by low inflation expectations) a small acute crisis in the fundamentals of oil, rising a bit above the 0.9%/year trend as it did in the 1970s, but this burp not substantially greater than in many former years such as in the 1970s, and I expect it, as occured in the 1980s, to reverse from technological substitutes for and conservation of oil which we are currently (as in the late 1970s and early 1980s) overinvesting in, due to monetary effects on oil prices being mistaken for fundamental ones. This mistake will reify as alternative energies and conservation techniques (barring unexpected technological breakthroughs), with stickier prices lagging those of oil in reflecting inflation expectations, increase in price faster than oil in the next decade (assuming no further monetary problems that further increase inflation expectations and thus oil prices). Prices besides oil, gold, and to a lesser extend other mineral commodities are far stickier than those mineral prices. Once inflation expectations increase, it takes many years for other prices (and especially the stickiest prices of all, wages) to catch up to oil and gold: these other prices greatly lag both increases and decreases in oil and gold prices, and indeed may never catch up at all if the expectations turn out to be wrong (as they indeed often are, given how little information the market actually has on future U.S. government and Fed behavior!)
 The second graph shows this expected versus the actual (or at least CPI-U) dollar inflation from 1968 to today. Again from the difference between oil and gold we can see some oil fundamentals such as the impact of the Asian/Russian crisis on lowering oil prices (in terms of gold as well as, in this case, dollars, as inflation expectations were also at their lowest) in 1998 and of the Iran/Iraq war which depressed oil prices in terms of gold in the 1980s (probably due to decreased security of long-term economic property rights in their oil and the need by these oil states to fund their war with limited ability to borrow).
Since I generated these graphs three weeks ago, there has been a substantial and as usual correlated drop in both dollar gold and oil prices, probably reflecting an easing of the credit crunch in the U.S. and more confidence that the Fed, seeing its inflationary behavior lead to immediate and politically consequential pain at the gas pump, is less likely to use high inflation to default on current U.S. debts than was thought in previous weeks. At the same time the overt default risk for Treasuries has nearly tripled, also reflecting some new political limits on inflationary default. By the way, in the most recent week the dollar also strengthened against the euro by a similar amount, so that the explanation for last week, but not most of the previous ones, involves a monetary improvement unique to the dollar rather than shared by the Fed and the ECB.

[UPDATE: here's a third graph showing implied inflation expectations derived from monthly quotes of gold and oil in dollars going back to 1974, using some different parameters than were used for the second graph econd graph. The two expectations have a correlation coefficient of 0.76. (I forgot to run the correlation with the parameters that generated the second graph, so I wanted to show the graph corresponding to the 0.76). This is still a strong correlation consistent with the long-term trends in oil and gold prices each reflecting a common estimate of future inflation -- gold and oil fundamentals are very different and so cannot lead to such strong correlation. This compared to two random walks with no long-term tendency to rise, which on average have no correlation.
Per the comments below, the 0.93 coefficient cited above might for statistical reasons suggest much more correlation than actually there due to the rising nature of both making the differences from the mean calculated in the coefficient consistently large and thus reducing the proportional difference in movements: a random walk that tends to rise can also have correlation coefficients in the .60's to .90's. Indeed taking correlations of differences we get only .25, on the high end of weak positive correlations, for one-week deltas, but this rises with the weeks of difference: I've calculated up to 40 week deltas which give 0.64, a strong correlation. This suggests that weekly fluctuations are dominated more by non-monetary factors and the monetary factors don't start to dominate until the price movements are over about 6 months: fundamental fluctuations tend to be shorter term and tend (except for the 0.9% secular trend for which I've adjusted the data) cancel each other out. There are also as I undestand it, and I am admittedly no statistical expert, statistical reasons to expect that the 0.25 is too low in that such differencing can exagerate noise. For the two implied inflation expectations in the third graph, which have a 0.76 correlation coefficient, the exageratedly small differences in proportion due to large distances from the mean should be greatly reduced since the series is largely flat, finishing pretty much where it started. But all this must be subject to review by people far more knowledge in statistics than I. :-) ]
Friday, August 08, 2008
Bank notes from the free banking era
I have a beautful private collection of bank notes from the Free Banking Era in the United States (1837-1863). During this era the U.S. had no central bank and paper money was issued by a variety of private banks. Some was even issued by manufacturing and retail companies. This money was backed by gold, silver, real estate, stocks, bonds, and a wide variety of other assets. You can no longer cash them in, but they are now worth often substantial sums as collectibles. As you can see below, the note designs were more varied and creative than modern money, and were remarkably free of politicians' faces.
Due to personal cash flow needs, I am selling some of my collection. Nobody is printing any more of this kind of money and it is a great hedge against inflation. As a collectible it is subject to less political risk than gold (recall FDR's confiscation of gold in the U.S., for example) or commodities (just watch C-SPAN to see what politicians want to do to commodities "speculators"). If you want to shop around, Google for what other people are asking. Make sure you're looking at fresh prices though -- as you might imagine, along with commodities and many other collectibles their dollar prices have risen substantially over the past year. You'll find that for most notes I'm offering a substantial discount.
Please send your order or query to me at nszabo AT law DOT gwu DOT edu. To compute the total charge add $10 for shipping and handling within the U.S., $20 if outside the continental U.S.
n.b.: The photos are of the actual notes you will get, next to their descriptions. (Some are a bit blurry, sorry -- I am going to try to get some clearer pics later). The notes are well protected and in the same shape I bought them, generally good to extremely fine. All my notes are hand-signed by issuers' officer(s) unless I indicate "not issued." You get your full money back (minus shipping) if you return them for any reason within 60 days.
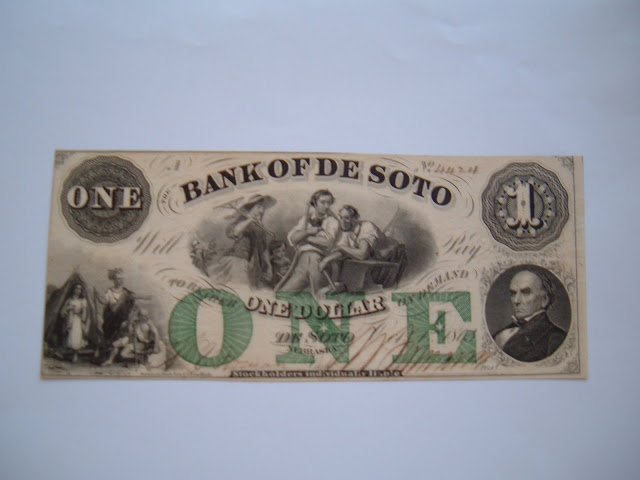
Bank of De Soto, Nebraska, $1 (1863)
$320
Boone County Bank, Indiania, $20 (1860)
$350
Tecumseh Bank, Michigan, $1 (year unknown)
$55. Not issued.

Store at Alleghany Furnace, $5 (1858)
$90. Not issued. "Allegheny Furnace" is misspelled "Alleghany Furnace." I don't know if this is unique to this note, or otherwise whether this fact is good, bad, or indifferent to the value.
Great Western Railroad Co., Iowa, $2 (1858)
$100. Two holes have been punched and bit of one corner has been cut out of this one, probably indicating that it is a cancelled note. Very rare.

Bank of Manchester, Michigan, $2 (1837)
$65

Hagerstown Bank, Maryland, $5 (probably 1857)
$85. Not issued.
Merchants and Mechanics Bank, Michigan, $5 (year unknown)
$125. Not issued.

Marine Fire Insurance Co., Wisconsin, $2 (1844)
$330
I also have a signed $1 Los Angeles Clearing House Certificate from the pre-Federal Reserve Days (1907), $15.
Please send your order or query to me at nszabo AT law DOT gwu DOT edu. To compute the total charge add $10 for shipping and handling within the U.S., $20 if outside the continental U.S.
Due to personal cash flow needs, I am selling some of my collection. Nobody is printing any more of this kind of money and it is a great hedge against inflation. As a collectible it is subject to less political risk than gold (recall FDR's confiscation of gold in the U.S., for example) or commodities (just watch C-SPAN to see what politicians want to do to commodities "speculators"). If you want to shop around, Google for what other people are asking. Make sure you're looking at fresh prices though -- as you might imagine, along with commodities and many other collectibles their dollar prices have risen substantially over the past year. You'll find that for most notes I'm offering a substantial discount.
Please send your order or query to me at nszabo AT law DOT gwu DOT edu. To compute the total charge add $10 for shipping and handling within the U.S., $20 if outside the continental U.S.
n.b.: The photos are of the actual notes you will get, next to their descriptions. (Some are a bit blurry, sorry -- I am going to try to get some clearer pics later). The notes are well protected and in the same shape I bought them, generally good to extremely fine. All my notes are hand-signed by issuers' officer(s) unless I indicate "not issued." You get your full money back (minus shipping) if you return them for any reason within 60 days.

Bank of De Soto, Nebraska, $1 (1863)
$320
Boone County Bank, Indiania, $20 (1860)
$350
Tecumseh Bank, Michigan, $1 (year unknown)
$55. Not issued.

Store at Alleghany Furnace, $5 (1858)
$90. Not issued. "Allegheny Furnace" is misspelled "Alleghany Furnace." I don't know if this is unique to this note, or otherwise whether this fact is good, bad, or indifferent to the value.
Great Western Railroad Co., Iowa, $2 (1858)
$100. Two holes have been punched and bit of one corner has been cut out of this one, probably indicating that it is a cancelled note. Very rare.

Bank of Manchester, Michigan, $2 (1837)
$65

Hagerstown Bank, Maryland, $5 (probably 1857)
$85. Not issued.
Merchants and Mechanics Bank, Michigan, $5 (year unknown)
$125. Not issued.

Marine Fire Insurance Co., Wisconsin, $2 (1844)
$330
I also have a signed $1 Los Angeles Clearing House Certificate from the pre-Federal Reserve Days (1907), $15.
Please send your order or query to me at nszabo AT law DOT gwu DOT edu. To compute the total charge add $10 for shipping and handling within the U.S., $20 if outside the continental U.S.


Saturday, July 19, 2008
Simulations of inflation expectations and oil prices
I have run some Monte Carlo simulations of hypothetical oil prices implied by long-term inflation expectations. Based on the Hotelling model of a nonrenewable resource, modified to account for inflation expectations, described here, inflation expectations are assumed to contemplate only the next 50 years, with a 1%/year discount rate. Oil in each year is assumed to be 1% less valuable to producers than in the preceeding year due to considerations of producer's time preferences, substitution, and less than perfectly secure property rights. Based on a random walk of inflation expectations (in some cases biased upward to show what happens in an era of increasing inflation expectations, in some cases downward to show happier times of declining inflation expectations), this simulation computes the net present value of the sale of a barrel of oil in 50 years based on the expected inflation over those years minus the discount rate of 1%. Note that these are not predictions I believe will happen, they are all explanations of what has happened or scenarios of what might happen.
The most startling and important thing you'll notice in these charts is that oil prices are an exponential function of long-run inflation expectations. Put another way, oil prices swing at a rate that is an exponential function of changes in these inflation expectations. The reason is quite straightforward -- inflation, like an interest rate, compounds. With inflation the value of oil in the ground nominally grows in value at the rate of inflation, discounted (in this model at 1%) for the factors indicated above. Thus in this model when inflation expectations are 1% or below, oil trades simply based on supply/demand fundamentals and expectations about these fundamentals, which in this model are assumed constant. Note that we assumd the discount rate (based on time preferences, substitability, property rights security, etc.) should be higher than 1%, that would only shift the exponential curve to the right, it wouldn't change its shape.
Precious metals generally move in the same way as oil in response to changing inflation expectations, but minerals that can be more readily substituted for than oil will probably not as quickly move to extreme prices. So this model and these simulations are just as useful for precious metals as they are for oil, and are somewhat less useful but still explain most of the price movements of most other minerals.
Here is a scenario similar to what we've recently experienced, with a possible further spike due to a small further increase in long-term inflation expectations, with such expectations then subsiding back to near today's value. The simulation starts out with inflations expectations at 1% (assumed to correspond to $10/barrel oil), then the expectations move to as high as 7.5%, which gives us $330/barrel oil:


Here is a more extreme scenario of what might occur during a possible U.S. federal default discussed in my previous post. At these extremes, prices of coal, natural gas, ethanol, and other near-substitutes for oil have to keep up with oil, and even the capital costs of more indirect substitutes (e.g. nuclear and alternative electricity) have to lose some of their stickiness and keep up more with oil, otherwise oil will be substituted for and prices won't reach these extremes. My model does not properly account for increased substitability as oil prices increase, which is correct over the long run (inflation eventually reaches all goods and services) but incorrect over the shorter run (because oil prices are much less sticky than most other energy prices). As a result these models probably overstate oil prices at the higher inflation expectation values. Precious metals don't have the same problem, so hedging against the most extreme possibilities is better done with precious metals than with oil or other commodities.


Let's finish with a cheerier scenario, where oil prices start at $130/barrel (roughly what they recently have been) and then inflation expectations subside. I consider this scenario and the first scenario about equally likely, and both of these more probable than the extreme second scenario:


The most startling and important thing you'll notice in these charts is that oil prices are an exponential function of long-run inflation expectations. Put another way, oil prices swing at a rate that is an exponential function of changes in these inflation expectations. The reason is quite straightforward -- inflation, like an interest rate, compounds. With inflation the value of oil in the ground nominally grows in value at the rate of inflation, discounted (in this model at 1%) for the factors indicated above. Thus in this model when inflation expectations are 1% or below, oil trades simply based on supply/demand fundamentals and expectations about these fundamentals, which in this model are assumed constant. Note that we assumd the discount rate (based on time preferences, substitability, property rights security, etc.) should be higher than 1%, that would only shift the exponential curve to the right, it wouldn't change its shape.
Precious metals generally move in the same way as oil in response to changing inflation expectations, but minerals that can be more readily substituted for than oil will probably not as quickly move to extreme prices. So this model and these simulations are just as useful for precious metals as they are for oil, and are somewhat less useful but still explain most of the price movements of most other minerals.
Here is a scenario similar to what we've recently experienced, with a possible further spike due to a small further increase in long-term inflation expectations, with such expectations then subsiding back to near today's value. The simulation starts out with inflations expectations at 1% (assumed to correspond to $10/barrel oil), then the expectations move to as high as 7.5%, which gives us $330/barrel oil:


Here is a more extreme scenario of what might occur during a possible U.S. federal default discussed in my previous post. At these extremes, prices of coal, natural gas, ethanol, and other near-substitutes for oil have to keep up with oil, and even the capital costs of more indirect substitutes (e.g. nuclear and alternative electricity) have to lose some of their stickiness and keep up more with oil, otherwise oil will be substituted for and prices won't reach these extremes. My model does not properly account for increased substitability as oil prices increase, which is correct over the long run (inflation eventually reaches all goods and services) but incorrect over the shorter run (because oil prices are much less sticky than most other energy prices). As a result these models probably overstate oil prices at the higher inflation expectation values. Precious metals don't have the same problem, so hedging against the most extreme possibilities is better done with precious metals than with oil or other commodities.


Let's finish with a cheerier scenario, where oil prices start at $130/barrel (roughly what they recently have been) and then inflation expectations subside. I consider this scenario and the first scenario about equally likely, and both of these more probable than the extreme second scenario:


Too big to fail
Besides the extraordinary rises in commodity prices and near-tripling of the U.S. federal government's default risk, another important factor for those interested the world's economy to keep in mind is that foreign governments have been bailing out the U.S. federal government by buying more of its Treasury bonds. Much of the increase in inflation expectations, and now in overt default expectations, reflected in commodity prices probably comes from the possibility that this ongoing foreign bailout of the U.S. may at some point stop and reverse. If foreign central banks and sovereign funds suddendly dumped their Treasuries -- which paying a negative real interest rate and exposing one to dollar risk are after all a rather bad investment -- either the Federal Reserve would have to madly "print" trillions of dollars to buy up these Treasuries, causing oil prices to skyrocket still further and retail gasoline prices to quite possibly jump each week by dollars per gallon, until American cars, trucks, and airplanes would be useless, or the federal government, facing extraordinary costs of funding its deficits, would have to overtly default. The problem the Federal Reserve faces is that with modern digital markets any inflationary behavior on its part is reflected in oil prices as soon as any big money learns about said behavior, and is thus usually reflected at the retail gas pump within a week. I wrote in the above-linked post about sovereign debt risk of "covert default" through inflation, but that is an obsolete phrase -- you can go down to the local gas station and see these de facto federal defaults in progress. If foreign governments thought the Federal Reserve was going to hyperinflate, that would probably cause them to dump the Treasuries in a kind of self-fulfilling prophecy. It would be a run on the federal government itself, the biggest run on a bank the world has ever seen. This is not a probable risk, but it has now become a quite signficant risk.
The ongoing foreign bailout of the U.S. government by massive purchases of Treasury debt helps explain two things: (1) why U.S. Treasuries and bank rates related to them don't seem to be reflecting inflation expectations (i.e. why they are paying negative real interest rates compared to the expected inflation suggested by commodity prices) -- their price is being held artificially low, not just by Federal Reserve net purchases but by foreign central bank net and sovereign fund purchases as well. Add to this the natural reduction in their interest rate due to the credit crunch causing a flight for safety (in a credit cruch people are willing to pay even negative real interest rates for a relatively safe investment). The foreign bailout also explains (2) why commodity prices have raced so far ahead of PPI and CPI inflation. Commodity prices may reflect, not so much increases in the dollar supply beyond dollar demand that have already happened, nor even expectations of a steady future consumer inflation that will happen eventually, nor an iminent severe consumer inflation is sure to happen soon, but expectations of a severe consumer inflation that mostly hasn't happened yet and may not happen, and of a possible Zimbabwe/Weimar-style hyperinflation that probably won't happen. But the increase in the probability of severe inflation combined with a great increase in the formerly extremely small (and still small, but not extremely so) probabilities of the more extreme hyperinflation still averages out to rather high inflation expectations.
Why are central bankers bailing out the U.S. federal government and its dollar rather than acting like rational profit maximizers? Central bankers and government treasury officials are very political animals, and they fear the disaster they believe would ensue should the "full faith and credit of the United States [federal government]" fail. It is the most unthinkable economic event for the entity with the most collosal budget, and the dominant threatener and wielder of military force in the world, to go under. The U.S. federal government has now deemed Bear Stearns, Fannie Mae, and Freddie Mac "too big to fail" and has bailed them out. That federal government itself is the ultimate entity that is "too big to fail", and thus foreign governments and central bankers are bailing it out, and will probably (but hardly surely) continue to do.
Extrapolating from oil prices rises (i.e. assuming the entire oil price rise has been due to monetary factors rather than to consumption, production cost, or non-monetary political fundamentals) using the net present value formula over 50 years, I estimate that long-run dollar inflation expectations have risen about 5%/year from 1998, when there the Asian crisis caused a flight to the dollar and many people thought deflation was the bigger worry, to today. This might for example reflect an increase in expectations from 0% to 5%/year, or 1% to 6%/year, etc. -- I don't have a way to estimate the absolute value. Gold price rises over the last decade give a slightly smaller rise in inflation expectations, of about 4%/year. Note that this doesn't mean 5% or 6%/year CPI or PPI inflation over the next 50 years is inevitable -- increased expectations reflect a range of probabilities, especially very heightened increases in probability estimates of extreme (>10%/year) and hyper (>100%/year) inflation in the dollar. It's also still significantly possible that the ultimate lagging indicator, "core inflation", will stay in the 2-3%/year range and the whole storm will blow over.
Besides the great rise in commodity prices, in particular the most "money-like" commodities oil and precious metals, the foreign bailout of the U.S. federal government is another reason to believe that all major currencies are falling against a hypothetical stable standard of value, not just the dollar. As foreign central banks buy more U.S. Treasuries they take on more of the risk associated with the dollar, so we should expect the floating currencies these central banks issue to move more in correlation with each other. Indeed, the dollar has held its own against the euro and against on average other major currencies since February as foreign central bank purchases of Treasuries have accelerated.
People interested in my writings about money might also want to check out my classic essay on monetary origins, "Shelling Out: The Origins of Money", my classic essay on micropayments, and my overview of the monetary reasons for the broad-based commodity price increases over the last decade and in particular over the last five years.
The ongoing foreign bailout of the U.S. government by massive purchases of Treasury debt helps explain two things: (1) why U.S. Treasuries and bank rates related to them don't seem to be reflecting inflation expectations (i.e. why they are paying negative real interest rates compared to the expected inflation suggested by commodity prices) -- their price is being held artificially low, not just by Federal Reserve net purchases but by foreign central bank net and sovereign fund purchases as well. Add to this the natural reduction in their interest rate due to the credit crunch causing a flight for safety (in a credit cruch people are willing to pay even negative real interest rates for a relatively safe investment). The foreign bailout also explains (2) why commodity prices have raced so far ahead of PPI and CPI inflation. Commodity prices may reflect, not so much increases in the dollar supply beyond dollar demand that have already happened, nor even expectations of a steady future consumer inflation that will happen eventually, nor an iminent severe consumer inflation is sure to happen soon, but expectations of a severe consumer inflation that mostly hasn't happened yet and may not happen, and of a possible Zimbabwe/Weimar-style hyperinflation that probably won't happen. But the increase in the probability of severe inflation combined with a great increase in the formerly extremely small (and still small, but not extremely so) probabilities of the more extreme hyperinflation still averages out to rather high inflation expectations.
Why are central bankers bailing out the U.S. federal government and its dollar rather than acting like rational profit maximizers? Central bankers and government treasury officials are very political animals, and they fear the disaster they believe would ensue should the "full faith and credit of the United States [federal government]" fail. It is the most unthinkable economic event for the entity with the most collosal budget, and the dominant threatener and wielder of military force in the world, to go under. The U.S. federal government has now deemed Bear Stearns, Fannie Mae, and Freddie Mac "too big to fail" and has bailed them out. That federal government itself is the ultimate entity that is "too big to fail", and thus foreign governments and central bankers are bailing it out, and will probably (but hardly surely) continue to do.
Extrapolating from oil prices rises (i.e. assuming the entire oil price rise has been due to monetary factors rather than to consumption, production cost, or non-monetary political fundamentals) using the net present value formula over 50 years, I estimate that long-run dollar inflation expectations have risen about 5%/year from 1998, when there the Asian crisis caused a flight to the dollar and many people thought deflation was the bigger worry, to today. This might for example reflect an increase in expectations from 0% to 5%/year, or 1% to 6%/year, etc. -- I don't have a way to estimate the absolute value. Gold price rises over the last decade give a slightly smaller rise in inflation expectations, of about 4%/year. Note that this doesn't mean 5% or 6%/year CPI or PPI inflation over the next 50 years is inevitable -- increased expectations reflect a range of probabilities, especially very heightened increases in probability estimates of extreme (>10%/year) and hyper (>100%/year) inflation in the dollar. It's also still significantly possible that the ultimate lagging indicator, "core inflation", will stay in the 2-3%/year range and the whole storm will blow over.
Besides the great rise in commodity prices, in particular the most "money-like" commodities oil and precious metals, the foreign bailout of the U.S. federal government is another reason to believe that all major currencies are falling against a hypothetical stable standard of value, not just the dollar. As foreign central banks buy more U.S. Treasuries they take on more of the risk associated with the dollar, so we should expect the floating currencies these central banks issue to move more in correlation with each other. Indeed, the dollar has held its own against the euro and against on average other major currencies since February as foreign central bank purchases of Treasuries have accelerated.
People interested in my writings about money might also want to check out my classic essay on monetary origins, "Shelling Out: The Origins of Money", my classic essay on micropayments, and my overview of the monetary reasons for the broad-based commodity price increases over the last decade and in particular over the last five years.
Thursday, July 17, 2008
So much for the "risk-free investment"
Last week the default risk on U.S. Treasury bonds doubled. This week it has increased still more. This risk is measured by credit default swaps (CDS's), which insure investors against bond defaults. Of course this risk, contrary to a very stupid but very popular myth among U.S. economists, has never has been zero: there is no such thing as a "risk-free" investment. Anybody with a modicum of knowledge of economic history knows (in other words, alas, very few people know) that over historical timeframes government defaults on their debt, both overt and covert (through inflation), are common. Indeed over >20 year timeframes even stocks are less risky than government bonds, but for shorter timeframes bonds are, in nominal terms at least, normally far less volatile than stocks. Reuters observed,
So far this week it has increased to 22 basis points for five years of default insurance. Bloomberg observes the probable cause of this increased risk:
In other words, not only is the Federal Reserve now playing John Law by printing dollars to buy bad real estate investments, but now the federal government has declared its willingness to get in on the act in an even bigger way.
Note that default risks measured by CDS's do not include the risks of what are effectively ongoing de facto mini-defaults on all dollar-denominated debt due to inflation, risks that have been rising substantially over the past ten years, as reflected by the prices of the main insurance against inflation risk, commodities.
In the U.S. there have been a number of de facto inflationary defaults on U.S. federal debt -- the Revolutionary War (Continentals), Civil War (Greenbacks), Great Depression (resetting the gold conversion rate). The largest de facto default occured in the 1970s (float and inflation) and we are in the midst of one currently (float and inflation) that may turn out to be even larger. But the only overt default on "national" governmental debt in our 232-year history was that of the Confederate States of America in the throes of losing its war against the (rest of the) U.S.
Compared to the 1970s, oil is responding faster and more completely to Fed inflation, and oil remains a crucial part of our industries. As a result, the havoc caused by high oil prices may put a stronger limit this time on how quickly the Fed shredder can dispose of the real value of U.S. paper. If the degree covert default is thus limited, but the risk of default increases, the risk of overt default rises. The market last week seemed to be saying that the Fed may be starting to approach some such limit, perhaps a political limit due to hysteria over gas and food prices, on its practical ability to inflate the U.S. currency. In other words, markets may be saying the Fed cannot necessary resort to a Weimar- or Zimbabwe-style hyperinflation -- that if federal financing gets to that extreme U.S. politicians may choose to overtly default instead.
The city of Vacaville, California recently overtly defaulted on its debt, as have a number of other municipalities in the U.S. Worldwide overt defaults on government debt during the second half of the 20th century usually occured in Third and Second World governments (e.g. Russia in the 1990s), but there were a large number of overt government defaults in governments of all sorts early in the Great Depression (indeed these were a leading cause of that economic disaster), and in prior centuries government defaults wherever governments borrowed money, including leading nations in Western Europe, were common. Mature democracies with central banks that can engage in covert defaults (inflation) have had a far lower rate of overt defaults than other forms of government or democracies without central banks.
That the risk of overt default has now substantially increased means that investors are are recognizing that the unprecedented revenue-generating combination created in 1913 -- IRS (which has been able to reliably collect $trillions per year) and the Federal Reserve (which has been reliably able to enage in covert gradual defaults by printing money to buy $trillions worth of Treasury debt per year) -- is not indestructible. U.S. Treasuries, like every other investment, have never been risk-free and they've just gotten quite a bit riskier. Nevertheless compared to historical averages for governments, the risk of overt default by that powerhouse 1913 duo is pretty low. With very high probability they will keep paying interest and principal on their debt while me and my fellow U.S. taxpayers will keep having to shell out substantial sums to the IRS every year, and see our dollars frittered away every year, that this dynamic duo may continue to uphold "the good faith and credit of the United States" while the discreditable activities, often done in rather poor faith, of the federal government in "redistributing" wealth, attacking foreign countries in very expensive ways, promising vast pensions that it cannot pay, promising health care that it cannot fund, and forcing private businesses to do bizarre things (like take on vast amounts of moral hazard by lending into "underserved communities", and to actually fund those government medical mandates) continues.
In related financial news, what I've been predicting for a long time would happen is starting to happen: the U.S. dollar inflation indices PPI and CPI, despite being under-reported compared to prior decades (due to a radical revision of the formulae), are starting to rise to 1970s rates of increase. Sticky prices in manufactured goods and services, as well as wages (the stickiest prices of all), are playing a very long-term game of catch-up to commodity prices, and especially to gold and oil, which are leading indicators of inflation. I continue to predict 5%-15%/year increases in the CPI and PPI, and probable "stagflation" (inflation plus recession, which according to Keynesians is not supposed to happen), until such time as they catch up to the commodity price increases. Commodity prices themselves, despite their stratospheric levels, may continue to increase as the Federal Reserve tries to deal with large government deficits and the fallout from the awful moral hazard in our housing markets, a moral hazard in no small part due to previous inflationary policy by the Fed itself combined with the outrageous pressures from U.S. politicians to relax lending standards in order to get people to buy houses in "under-served communities" and naive "real estate always goes up" bubble behavior on the part of the real estate industry and house buyers. The Fed-and-IRS-backed political franchises Freddie Mac and Fannie Mae have been moral hazard disasters waiting to happen. Inflation is still by far the largest problem these federal activities are causing; the doubling of the overt default risk is just an interesting related blip. My recommendation: keep only spending money, not savings or long-term investments, in dollars or dollar-denominated debt, and keep trying to unstick your own wages by frequently asking your boss for a big raise.
On the increase in Treasury default risk H/T to Alex Tabarrok.
The cost to insure Treasury debt with credit default swaps jumped to 16.5 basis points, or $16,500 per year for five years to insure $10 million in debt, from 8 basis points on Thursday, an analyst said....Debt protection costs on U.S. government debt are now higher than those for Germany, which trades at 9.5 basis points, and are trading at similar levels as Japan and the United Kingdom, which are around 16.5 basis points, the analyst said.
So far this week it has increased to 22 basis points for five years of default insurance. Bloomberg observes the probable cause of this increased risk:
Treasury Secretary Henry Paulson said July 13 the U.S. would seek authority from Congress to buy unlimited equity in so-called government-sponsored enterprises Fannie Mae and Freddie Mac and to extend them as much credit as needed. The move effectively put the weight of the treasury behind the companies, which own or guarantee almost half of the $12 trillion in U.S. home loans outstanding. The Federal Reserve also agreed to lend directly to Fannie Mae and Freddie Mac.
In other words, not only is the Federal Reserve now playing John Law by printing dollars to buy bad real estate investments, but now the federal government has declared its willingness to get in on the act in an even bigger way.
Note that default risks measured by CDS's do not include the risks of what are effectively ongoing de facto mini-defaults on all dollar-denominated debt due to inflation, risks that have been rising substantially over the past ten years, as reflected by the prices of the main insurance against inflation risk, commodities.
In the U.S. there have been a number of de facto inflationary defaults on U.S. federal debt -- the Revolutionary War (Continentals), Civil War (Greenbacks), Great Depression (resetting the gold conversion rate). The largest de facto default occured in the 1970s (float and inflation) and we are in the midst of one currently (float and inflation) that may turn out to be even larger. But the only overt default on "national" governmental debt in our 232-year history was that of the Confederate States of America in the throes of losing its war against the (rest of the) U.S.
Compared to the 1970s, oil is responding faster and more completely to Fed inflation, and oil remains a crucial part of our industries. As a result, the havoc caused by high oil prices may put a stronger limit this time on how quickly the Fed shredder can dispose of the real value of U.S. paper. If the degree covert default is thus limited, but the risk of default increases, the risk of overt default rises. The market last week seemed to be saying that the Fed may be starting to approach some such limit, perhaps a political limit due to hysteria over gas and food prices, on its practical ability to inflate the U.S. currency. In other words, markets may be saying the Fed cannot necessary resort to a Weimar- or Zimbabwe-style hyperinflation -- that if federal financing gets to that extreme U.S. politicians may choose to overtly default instead.
The city of Vacaville, California recently overtly defaulted on its debt, as have a number of other municipalities in the U.S. Worldwide overt defaults on government debt during the second half of the 20th century usually occured in Third and Second World governments (e.g. Russia in the 1990s), but there were a large number of overt government defaults in governments of all sorts early in the Great Depression (indeed these were a leading cause of that economic disaster), and in prior centuries government defaults wherever governments borrowed money, including leading nations in Western Europe, were common. Mature democracies with central banks that can engage in covert defaults (inflation) have had a far lower rate of overt defaults than other forms of government or democracies without central banks.
That the risk of overt default has now substantially increased means that investors are are recognizing that the unprecedented revenue-generating combination created in 1913 -- IRS (which has been able to reliably collect $trillions per year) and the Federal Reserve (which has been reliably able to enage in covert gradual defaults by printing money to buy $trillions worth of Treasury debt per year) -- is not indestructible. U.S. Treasuries, like every other investment, have never been risk-free and they've just gotten quite a bit riskier. Nevertheless compared to historical averages for governments, the risk of overt default by that powerhouse 1913 duo is pretty low. With very high probability they will keep paying interest and principal on their debt while me and my fellow U.S. taxpayers will keep having to shell out substantial sums to the IRS every year, and see our dollars frittered away every year, that this dynamic duo may continue to uphold "the good faith and credit of the United States" while the discreditable activities, often done in rather poor faith, of the federal government in "redistributing" wealth, attacking foreign countries in very expensive ways, promising vast pensions that it cannot pay, promising health care that it cannot fund, and forcing private businesses to do bizarre things (like take on vast amounts of moral hazard by lending into "underserved communities", and to actually fund those government medical mandates) continues.
In related financial news, what I've been predicting for a long time would happen is starting to happen: the U.S. dollar inflation indices PPI and CPI, despite being under-reported compared to prior decades (due to a radical revision of the formulae), are starting to rise to 1970s rates of increase. Sticky prices in manufactured goods and services, as well as wages (the stickiest prices of all), are playing a very long-term game of catch-up to commodity prices, and especially to gold and oil, which are leading indicators of inflation. I continue to predict 5%-15%/year increases in the CPI and PPI, and probable "stagflation" (inflation plus recession, which according to Keynesians is not supposed to happen), until such time as they catch up to the commodity price increases. Commodity prices themselves, despite their stratospheric levels, may continue to increase as the Federal Reserve tries to deal with large government deficits and the fallout from the awful moral hazard in our housing markets, a moral hazard in no small part due to previous inflationary policy by the Fed itself combined with the outrageous pressures from U.S. politicians to relax lending standards in order to get people to buy houses in "under-served communities" and naive "real estate always goes up" bubble behavior on the part of the real estate industry and house buyers. The Fed-and-IRS-backed political franchises Freddie Mac and Fannie Mae have been moral hazard disasters waiting to happen. Inflation is still by far the largest problem these federal activities are causing; the doubling of the overt default risk is just an interesting related blip. My recommendation: keep only spending money, not savings or long-term investments, in dollars or dollar-denominated debt, and keep trying to unstick your own wages by frequently asking your boss for a big raise.
On the increase in Treasury default risk H/T to Alex Tabarrok.
Monday, July 14, 2008
Hampton Sides sheds light on Mancur Olson and Ronald Coase
 Hampton Sides' book Blood and Thunder is a detailed and colorful account of the Western frontier in the United States around the mid-19th century, mostly from the Mexican War to the Civil War. It is half biography of the trapper, guide, and soldier Kit Carson, who participated in a wide variety of interesting and important events, and half general history, mostly of what is now the Southwestern U.S. and much of that in New Mexico, where Navajo, Apache, Pueblo, Mexicans, and Americans collided. There is also some coverage of the prior history and prehistory of the Mexicans and "Indian" (aboriginal American) tribes in the area. Sides seems to have no theoretical axe to grind, and indeed doesn't try to explain events in terms of political or economic theories, but rather simply relates a large number of incidents in unabashed detail, letting readers draw whatever theories, if any, the reader might wish to draw. Nevertheless Sides' account of the old U.S. frontier does shed quite a bit of light on a number of theoretical topics I have discussed here.
Most of the book involves interactions between Indian tribes, often nomadic, and agricultural-based Mexican and Anglo-Saxon cultures. The Navajo, for example, were nomadic herders that also profited from stealing, usually livestock, from nearby Pueblo, Mexican, and later United States ranches. In his account of prehistory Sides relates how, a few hundred years before Columbus, the spectacular pueblos (apartment buildings) of the Anasazi farm-based civilization in the Chaco Canyon were abandoned just as the Navajo were migrating into Anasazi territory from the north. Sides invokes as the main reason the popular ecological theory: that the Anasazi declined due to depleting nearby resources such as soils and forests, and suggests the Navajo as a contributing reason.
I think this gets it backwards. The Navajo entry at the same time the Anasazi's pueblos were abandoned is no coincidence, it is the main cause. Faced by a militarily superior group of roving bandits, the Anasazi's agricultural property was no longer secure. The Anasazi, ruled by stationary bandits, were conquered by the Navajo, nomadic herders and hunters. Further evidence that Mancur Olson's bandit theory, rather than ecological theory, explains the abandonment of their civilization in the Chaco Canyon is that the Anasazi culture didn't disappear, it declined and moved. Their descendants are the Pueblo Indians, and they dispersed to build a pueblos at the fringes of the Navajo territory. ("Anasazi", incidentally, is a Navajo term meaning "ancestors of our enemies"). Accelerated depletion of resources is a symptom of insecure property rights: where property is insecure people act (with respect to natural resources rather than with respect to fellow humans) as roving bandits, whereas secure property owners extract their resources like stationary bandits, i.e. at a much lower and far more sustainable rate.
Per Olson the Navajo, being roving bandits (with respect to both people and fixed resources) would have had a far higher Laffer maximum extortion rate and thus were not able to accumulate wealth to support a level of civilization nearly as high as the Anasazi under stationary bandits had supported. The Pueblo Indians and later the Mexicans who bordered the Navajos and other roving bandit cultures were able to support agriculture, but were far poorer than other most other fully agricultural regions of the time due to the costs of Navajo and Apache raids. The fall of the Anasazi was hardly the first time roving bandits had conquered stationary bandits causing a massive decline in wealth and civilization: it is a common pattern throughout history.
(Incidentally, the Laffer maximum for banditry from a sedentary neighbor, where there are a few but not many competing bandits, is probably somewhere in between the maxima for fully roving and fully stationary bandits: Sides recounts how the Navajo would not steal every animal from their Pueblo or Mexican neighbors during raids, but made sure to leave them enough breeding stock to rebuild their herds).
There are a large number of people who, following David Friedman, use the Coase Theorem as if it applied to the coercive bargaining that occurs in an anarchy. Sides' relentless accounts of attacks and reprisals put a lie to this Coaseian analysis of anarchy. The Navajo came as close, perhaps, to anarchy has any recorded culture has ever come. They had, for example, no sovereign leaders with which to make binding treaties. When American generals tried to make treaties with individuals they thought were Navajo chiefs, they would find that said "chiefs" could not actually enforce treaty terms, at least not beyond their own small band. Thus promises, for example, by Navajo "chiefs" to stop animal-stealing raids turned out to be unenforceable, because these "chiefs" could not actually punish young men in the many other Navajo bands for their raiding. (Even with sovereign governments there is still a tension between limiting the scope of sovereign power, e.g. by a doctrine of enumerated powers or by federalism, and giving the federal government complete "freedom of treaty", i.e. the ability to enter treaties on any subject, or at least in suppression of any kind of coercion, that they can actually enforce against their citizens and residents).
Coercion in all the forms one can imagine, and many that one would rather not try to imagine, was endemic to life among the native American tribes and to relations between those tribes and encroaching civilizations of the Mexicans and later Americans. Raids involving theft (especially of livestock), looting, kidnapping, rape, murder, war, massacre, torture, extortion, mutilation of the living and the dead, and many other, shall we say, non-Coaseian interactions were a normal part of the external relationships between the Indian tribes and between the encroaching civilizations and those tribes. "Counting coup", that is keeping track of wrongs that needed to be avenged, was standard among the Indian cultures and became standard among people like Kit Carson who dealt with them. Another interesting phenomenon is that the tit-for-tat cycle of violence between tribes was often based on group blame: rather than solving the (usually insurmountable) problem of identifying and punishing the particular perpetrators, missions of vengeance would usually target relatives, fellow tribe members, or even broader groups that happened to be convenient. Sometimes Indians aggrieved by a white attack would even take revenge on whites generally, for example the next group of white emigrants to come down the Santa Fe Trail, and this far too often happened in the reverse direction as well. Sometimes individual blame morphed into group blame when a tribe to which an alleged perpetrator was thought to belong failed to arrest and surrender the accused. This circumstance was especially used by American armies to justify invasion, massacre, and ethnic cleansing of tribes that refused to surrender or punish (often because they had no sovereign power to capture or punish) their thieves, kidnappers, and murderers. The role such group blame plays in contemporary politics is left as an exercise for the reader.
Mancur Olson's explanations fit Sides' detailed accounts of life in an anarchy far better than the the Coaseians'. The trajectories of the Anasazi, Navajo, Pueblo, Mexicans, and Americans are classic cases of interactions between stationary and roving bandits. The Laffer maximum extortion of the stationary bandit is far lower than the combined Laffer maxima of the roving bandits. Most kinds of farms can operate economically only if those stealing from the farm are stationary rather than roving.
Finally, Sides gives a sad account of the utopian social engineering that led to America's Indian reservation system. Bosque Redondo (the Round Forest) is a tragic example of this: an idealistic general of New England upbringing, a forerunner is spirit at least of the Bellamies, rounded up the Navajos, marched them off to a promising-looking but empty stretch of the Pecos River and tried to teach them sedentary agriculture. The general's overall reason for for conducting this experiment was not inaccurate: in Olson's terms, the Navajo would give up their roving banditry only if converted into (or put under the thumb of) stationary bandits. But just as the Navajos did not learn to live like Anasazi, but instead displaced the Anasazi culture with their own, so they could not readily learn to live like Mexicans or Americans, or even like Pueblo Indians. For example, for religious reasons they stubbornly refused to live in pueblos (apartment buildings) and these had to be abandoned. Worse, the project had most of the trappings of utopia we would later see in the Soviet Union: forced concentration and mass movement of peoples, communal farms, and military-style central planning. The communal property and military command structure under which the Navajo were subjected utterly failed to replicate the property rights and other crucial aspects of legal systems under which Mexicans and Americans had successfully conducted their agriculture. The Bosque Redondo experiment was a miserable and deadly failure. Stationary bandits can also destroy rather than allow the building of civilization if their policies are sufficiently pathological.
Tuesday, June 24, 2008
Commodity hysteria -- an overview
Congress is going crazy over commodities, and especially over oil. They are convinced that we have a commodities bubble, so that all they have to do is smash down their boogymen, "the speculators", and all will be hunky dory. They are convinced of this because those supply/demand curves in the first chapter of our Econ 101 textbook no longer seem to be working for commodities.
This article provides an overview of the state of the commodities markets -- follow the links for more explanation of the various topics.
Those supply/demand curves in the first chapter of your Econ 101 textbook assumed that goods are sold for some fix standard of value, a currency. But under floating currencies, which the world has had since the U.S. went off gold in 1970, there is no fixed standard of value. When trading commodities, supply and demand for the currencies they are traded for must now be taken into account. A long commodity position is also a short currency position, and vice versa. Furthermore, expectations about future supply and demand for currencies must be accounted for. Under floating currencies and a free market in commodities, commodity prices, especially for commodities like oil and gold where the stockpile (whether below or above ground) to production ratio is very high and storage costs low, are highly volatile – a small change in inflation expectations causes a very large change in commodity prices. The commodities themselves start to act like gold: to take on monetary functions such as a store of value or a hedge for currency-denominated debt. The logical emergence of money from barter is taking place every day as commodities come to serve these monetary functions better than floating currencies.
The critics complain that commodities markets, no longer reflecting Econ 101 supply and demand, are no longer providing reliable price signals. In fact commodity prices still are reflecting Econ 101 supply and demand, but this often tends to get buried in the noise of the much larger price changes caused by changes in inflation expectations. The fault lies with poorly managed floating currencies, not with attempts by currencies users to protect against the damage done by floating currencies, for example by hedging their dollar-denominated investment portfolios with long commodity positions. Trying to stop "speculation" will be like curing a fever by attacking the immune system. You may get rid of the fever, but you won't get rid of the flu, and the patient, no longer protected, may end up six feet under.
The evidence for all this, such as the great rise in the use of commodity derivatives and commodity index ETFs (exchange-traded funds) and ETNs (exchange-traded notes) by long-term investors such as pension funds, endowments, and sovereign wealth funds, in parallel the great recent rises in commodity prices, are lumped by critics under their derogatory label of "speculation." Another, and probably even larger, source of the oil run-up are decisions by producers to keep oil in the ground (where its storage costs are cheapest) rather than pump it only to sell it for depreciating dollars. Similarly, there has been a great deal of informal "hoarding" of food. Here the commodity is being stored by those who expect to consume, or who expect their customers to consume, the commodity in the future. The stockpile is a hedge against both the falling currencies and political risk that governments might hoard and ration the food. This “tacit speculation” too reflects an increase in inflation expectations. If or when inflation expectations decrease, we can expect (contrary to “peak oil” theory) oil pumping to greatly increase, as having dollars will once again become more valuable than having oil in the ground, and we can expect informal food stockpiles to be drawn down and food prices to drop.
These are all attempts to preserve wealth in the face of a highly uncertain, and probably falling, value of the future dollar and other floating currencies. In the era of floating currencies, not only are commodities a legitimate asset class, they are an essential asset class. Floating currencies add a very large and dominating amount of noise to commodity price signals when inflation expectations change, but there is no easy fix for this problem.
Attacks against commodity "speculation" are attacks against efforts to protect property and markets against highly uncertain currencies. Without this protection, economies will be in grave danger of wealth destruction. Instead of attacking "speculation", the great increase in trade of "paper barrels" or "video barrels" should be encouraged. The more commodities can be traded as bits instead of by shipping physical commodities, the lower the transaction costs that will be imposed on tradition physical delivery markets. The "rolling-over" of commodities futures -- when expiring futures are swapped for distant futures instead of taking delivery of the physical commodity -- should be formalized in long-term commodities securities that minimally disrupt traditional "commercial" commodity hedging operations.
We may be seeing only the first stages of a switch from floating currencies, which may be proving to be unworkable, to commodity-backed currencies. Floating currencies were and are a great historical experiment, and there is no guarantee that such experiments will work out in the long run. By serving monetary functions such as stores of value and hedges against currency-denominated debt, commodity index ETFs and ETNs are starting to serve as monetary substitutes. But the benefits so far have been limited to investors and other big players. Those saving for retirement or who will have to pay for their child's education are benefitting from the use of commodity long positions to stablize pension and endowment funds against falling currencies and protect them against future inflation. But we still have to take our wages in floating currencies, hold our checking and savings accounts in floating currencies, and pay or be paid our debts in floating currencies. Can commodity money move from Wall Street to Main Street?
There are, alas, great legal barriers to retail commodity money. While legal barriers often just increase costs by a few basis points for Wall Street, they usually prove insuperable for the man in the street. To remove these legal barriers, contracts in any part of the economy should be allowed to use commodity index ETFs or other standards of choice as payment terms. Negotiable instruments law in the U.S. must be changed to allow payments by check, money order, etc. in commodity standards to compete against government currencies on a level playing field. Legal tender laws requiring an option to pay debts in particular currencies should be eliminated in order to allow payment terms denominated in commodity indices to be as simple as payment terms denominated in dollars. These kinds of reforms will bring the benefits of stable commodity money from Wall Street to the man in the street.
If the Federal Reserve decided to use leading indicators (e.g. commodities) instead of trailing indicators (e.g. the Consumer Price Index, CPI) to fight inflation, or decided to go to a de facto commodity index or back to the gold standard, and stopped bad practices such as "printing" dollars to swap for dubious real estate securities, we would not need to otherwise use commodities for monetary purposes. If the Federal Reserve or the European Central Bank prove incable of providing a stable currency, commodity money will provide the long-term stability that our floating currencies since 1970 have usually not exhibited. The more governments try to fight the use of commodities for monetary purposes, the more painful the effects of poorly managed floating currencies will be, and the more painful the resulting transition from those floating currencies to commodity money will be.
This article provides an overview of the state of the commodities markets -- follow the links for more explanation of the various topics.
Those supply/demand curves in the first chapter of your Econ 101 textbook assumed that goods are sold for some fix standard of value, a currency. But under floating currencies, which the world has had since the U.S. went off gold in 1970, there is no fixed standard of value. When trading commodities, supply and demand for the currencies they are traded for must now be taken into account. A long commodity position is also a short currency position, and vice versa. Furthermore, expectations about future supply and demand for currencies must be accounted for. Under floating currencies and a free market in commodities, commodity prices, especially for commodities like oil and gold where the stockpile (whether below or above ground) to production ratio is very high and storage costs low, are highly volatile – a small change in inflation expectations causes a very large change in commodity prices. The commodities themselves start to act like gold: to take on monetary functions such as a store of value or a hedge for currency-denominated debt. The logical emergence of money from barter is taking place every day as commodities come to serve these monetary functions better than floating currencies.
The critics complain that commodities markets, no longer reflecting Econ 101 supply and demand, are no longer providing reliable price signals. In fact commodity prices still are reflecting Econ 101 supply and demand, but this often tends to get buried in the noise of the much larger price changes caused by changes in inflation expectations. The fault lies with poorly managed floating currencies, not with attempts by currencies users to protect against the damage done by floating currencies, for example by hedging their dollar-denominated investment portfolios with long commodity positions. Trying to stop "speculation" will be like curing a fever by attacking the immune system. You may get rid of the fever, but you won't get rid of the flu, and the patient, no longer protected, may end up six feet under.
The evidence for all this, such as the great rise in the use of commodity derivatives and commodity index ETFs (exchange-traded funds) and ETNs (exchange-traded notes) by long-term investors such as pension funds, endowments, and sovereign wealth funds, in parallel the great recent rises in commodity prices, are lumped by critics under their derogatory label of "speculation." Another, and probably even larger, source of the oil run-up are decisions by producers to keep oil in the ground (where its storage costs are cheapest) rather than pump it only to sell it for depreciating dollars. Similarly, there has been a great deal of informal "hoarding" of food. Here the commodity is being stored by those who expect to consume, or who expect their customers to consume, the commodity in the future. The stockpile is a hedge against both the falling currencies and political risk that governments might hoard and ration the food. This “tacit speculation” too reflects an increase in inflation expectations. If or when inflation expectations decrease, we can expect (contrary to “peak oil” theory) oil pumping to greatly increase, as having dollars will once again become more valuable than having oil in the ground, and we can expect informal food stockpiles to be drawn down and food prices to drop.
These are all attempts to preserve wealth in the face of a highly uncertain, and probably falling, value of the future dollar and other floating currencies. In the era of floating currencies, not only are commodities a legitimate asset class, they are an essential asset class. Floating currencies add a very large and dominating amount of noise to commodity price signals when inflation expectations change, but there is no easy fix for this problem.
Attacks against commodity "speculation" are attacks against efforts to protect property and markets against highly uncertain currencies. Without this protection, economies will be in grave danger of wealth destruction. Instead of attacking "speculation", the great increase in trade of "paper barrels" or "video barrels" should be encouraged. The more commodities can be traded as bits instead of by shipping physical commodities, the lower the transaction costs that will be imposed on tradition physical delivery markets. The "rolling-over" of commodities futures -- when expiring futures are swapped for distant futures instead of taking delivery of the physical commodity -- should be formalized in long-term commodities securities that minimally disrupt traditional "commercial" commodity hedging operations.
We may be seeing only the first stages of a switch from floating currencies, which may be proving to be unworkable, to commodity-backed currencies. Floating currencies were and are a great historical experiment, and there is no guarantee that such experiments will work out in the long run. By serving monetary functions such as stores of value and hedges against currency-denominated debt, commodity index ETFs and ETNs are starting to serve as monetary substitutes. But the benefits so far have been limited to investors and other big players. Those saving for retirement or who will have to pay for their child's education are benefitting from the use of commodity long positions to stablize pension and endowment funds against falling currencies and protect them against future inflation. But we still have to take our wages in floating currencies, hold our checking and savings accounts in floating currencies, and pay or be paid our debts in floating currencies. Can commodity money move from Wall Street to Main Street?
There are, alas, great legal barriers to retail commodity money. While legal barriers often just increase costs by a few basis points for Wall Street, they usually prove insuperable for the man in the street. To remove these legal barriers, contracts in any part of the economy should be allowed to use commodity index ETFs or other standards of choice as payment terms. Negotiable instruments law in the U.S. must be changed to allow payments by check, money order, etc. in commodity standards to compete against government currencies on a level playing field. Legal tender laws requiring an option to pay debts in particular currencies should be eliminated in order to allow payment terms denominated in commodity indices to be as simple as payment terms denominated in dollars. These kinds of reforms will bring the benefits of stable commodity money from Wall Street to the man in the street.
If the Federal Reserve decided to use leading indicators (e.g. commodities) instead of trailing indicators (e.g. the Consumer Price Index, CPI) to fight inflation, or decided to go to a de facto commodity index or back to the gold standard, and stopped bad practices such as "printing" dollars to swap for dubious real estate securities, we would not need to otherwise use commodities for monetary purposes. If the Federal Reserve or the European Central Bank prove incable of providing a stable currency, commodity money will provide the long-term stability that our floating currencies since 1970 have usually not exhibited. The more governments try to fight the use of commodities for monetary purposes, the more painful the effects of poorly managed floating currencies will be, and the more painful the resulting transition from those floating currencies to commodity money will be.
Subscribe to:
Posts (Atom)